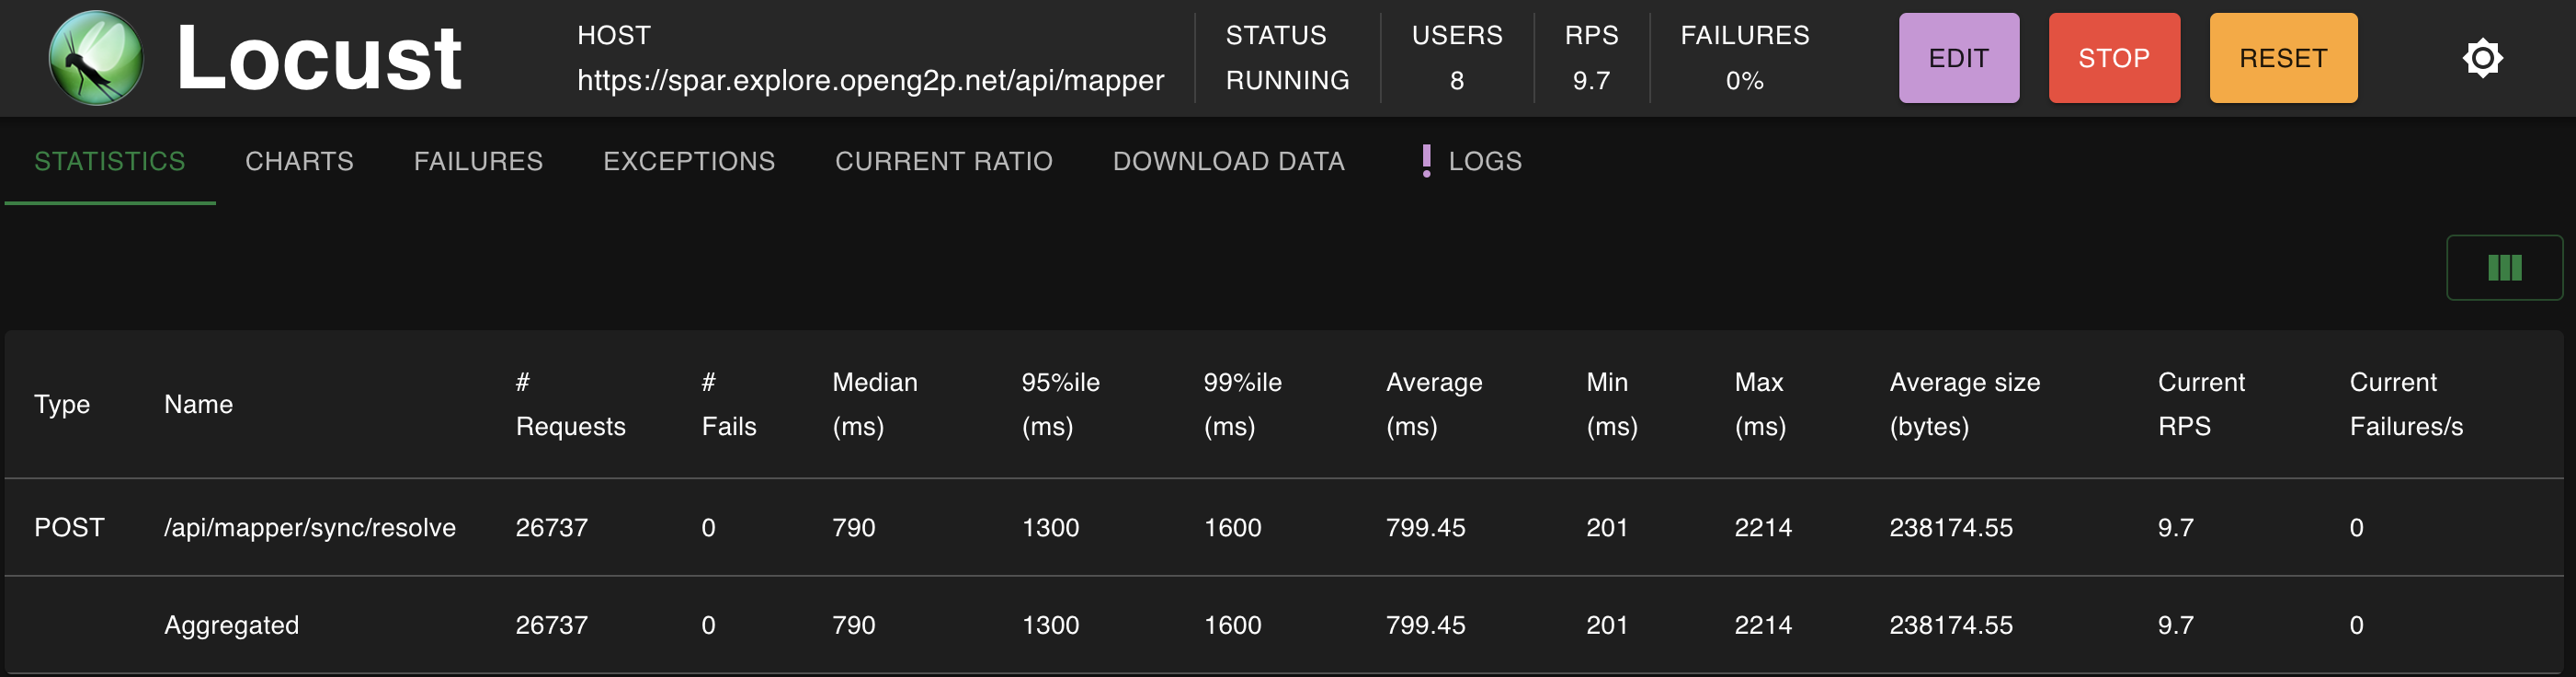
Locust Dashboard - 30 minutes - 8 concurrent users - 1000 records per API
| POD | CPU Utilization | Memory Utilization |
|---|---|---|
| Mapper POD | 0.0225 cpu | 477 MB |
| Postgres POD | 0.0080 cpu | 20 MB |
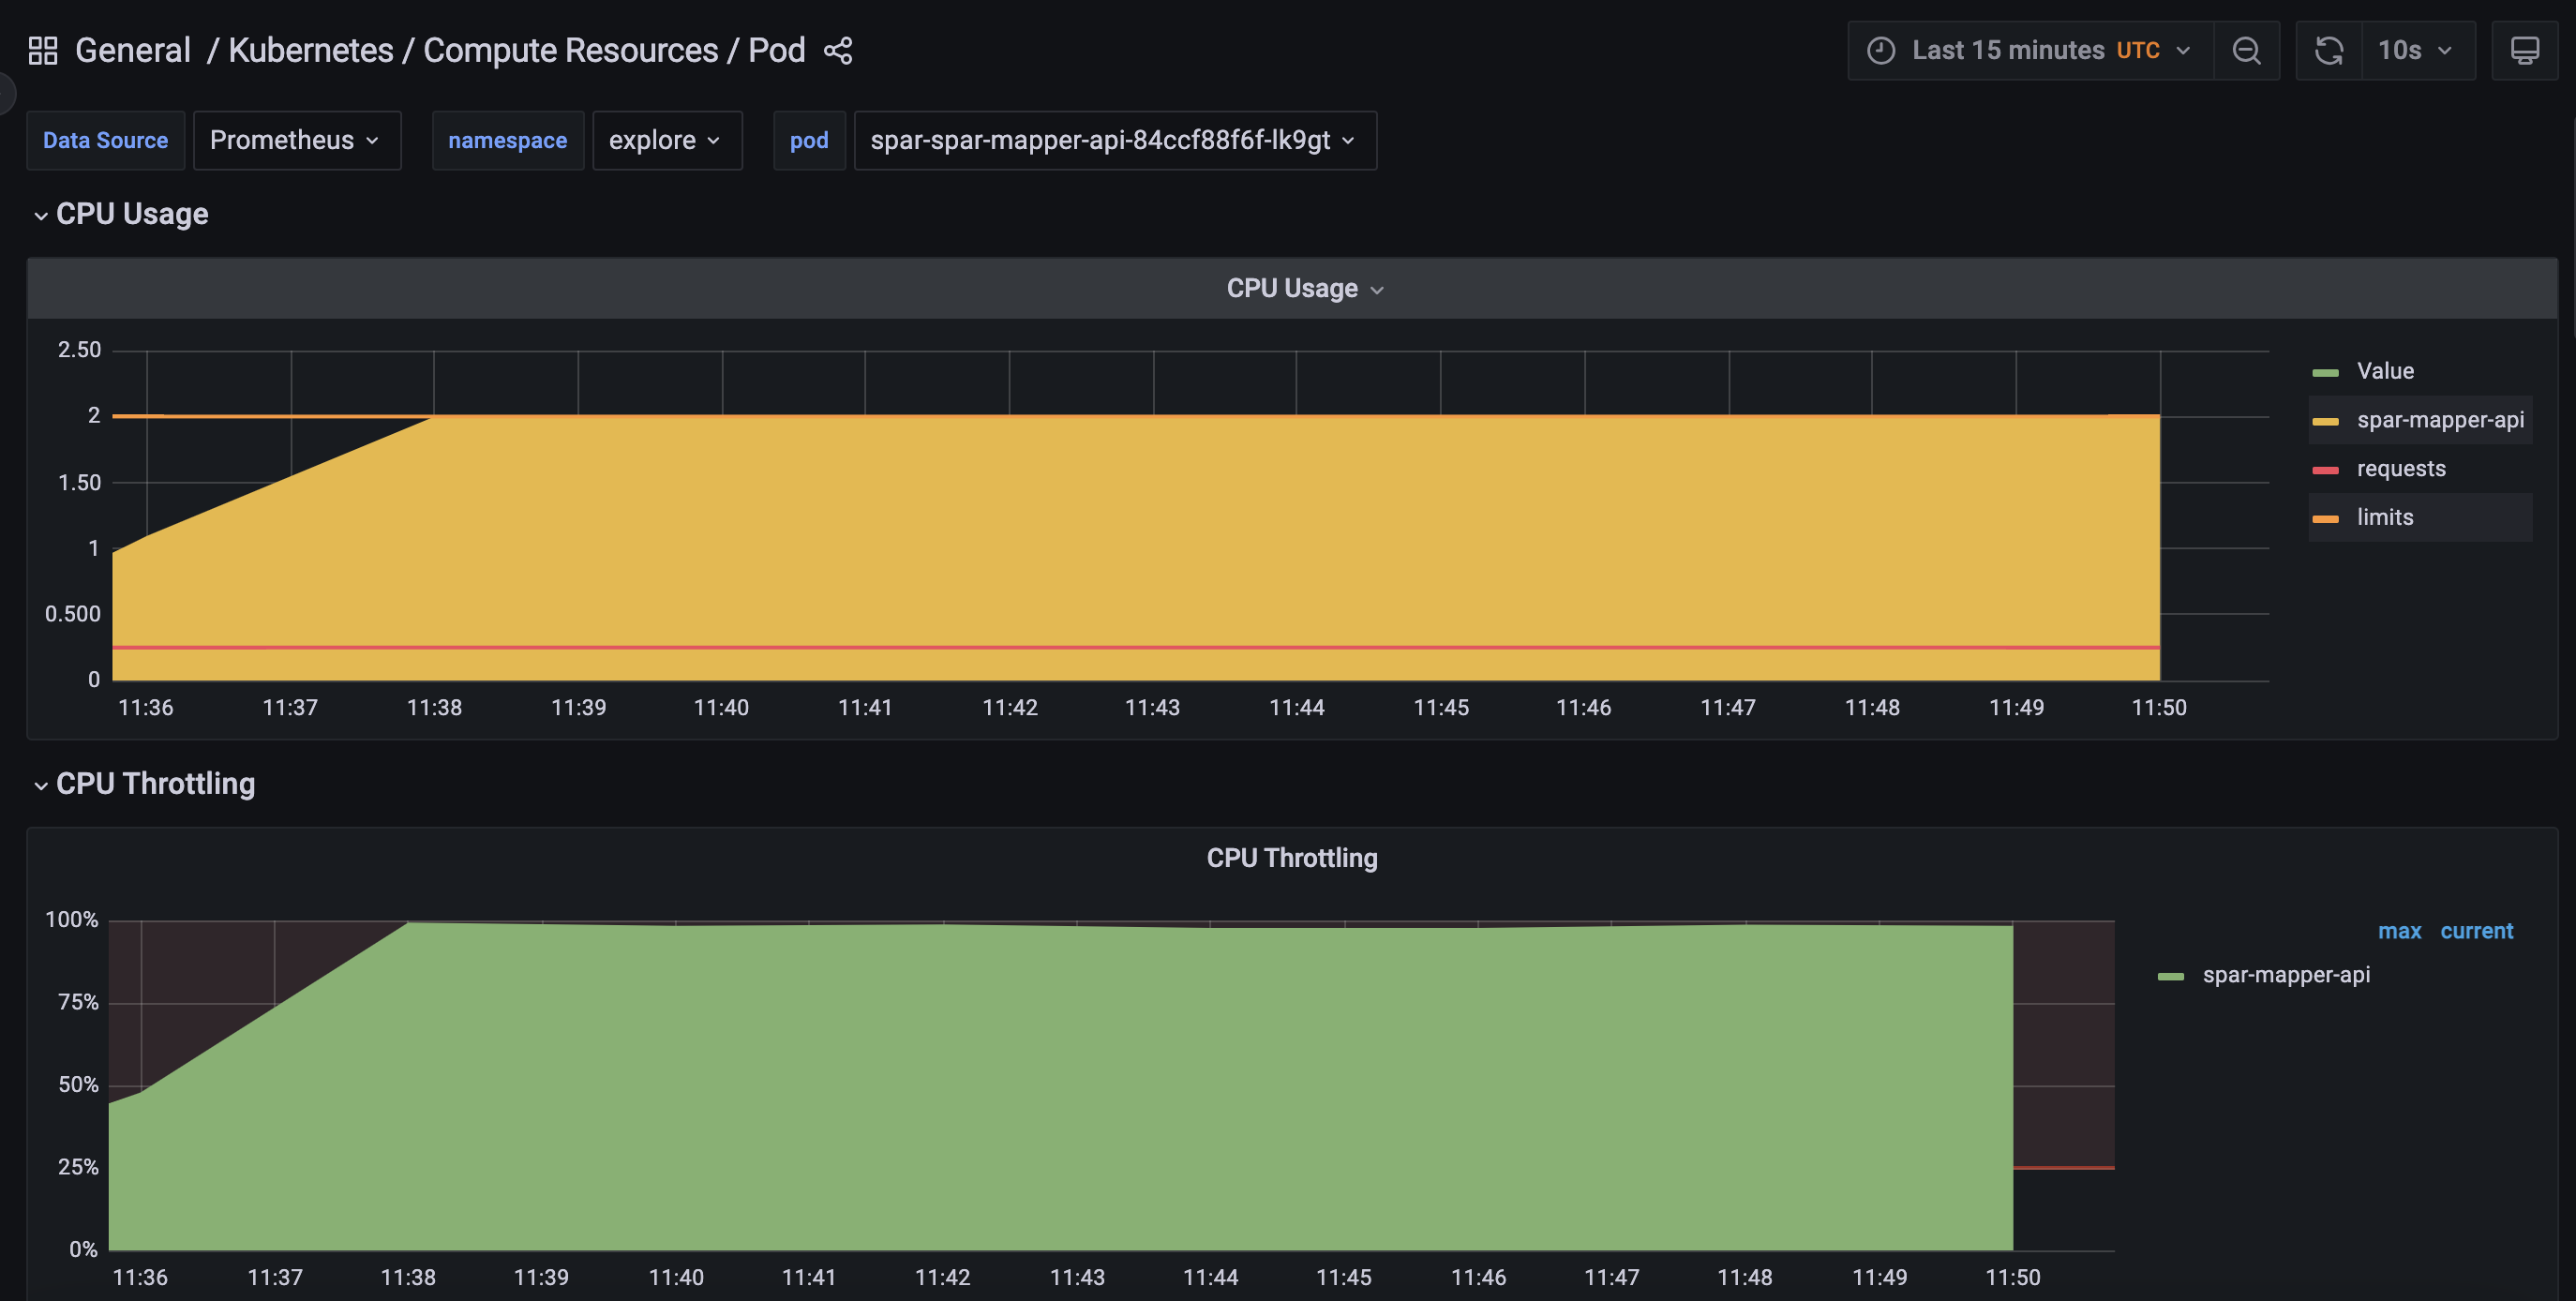
| POD | CPU Utilization | Memory Utilization |
|---|---|---|
| Mapper POD | 2 cpu | 546 MB |
| Postgres POD | 0.25 cpu | 1.7 GB |
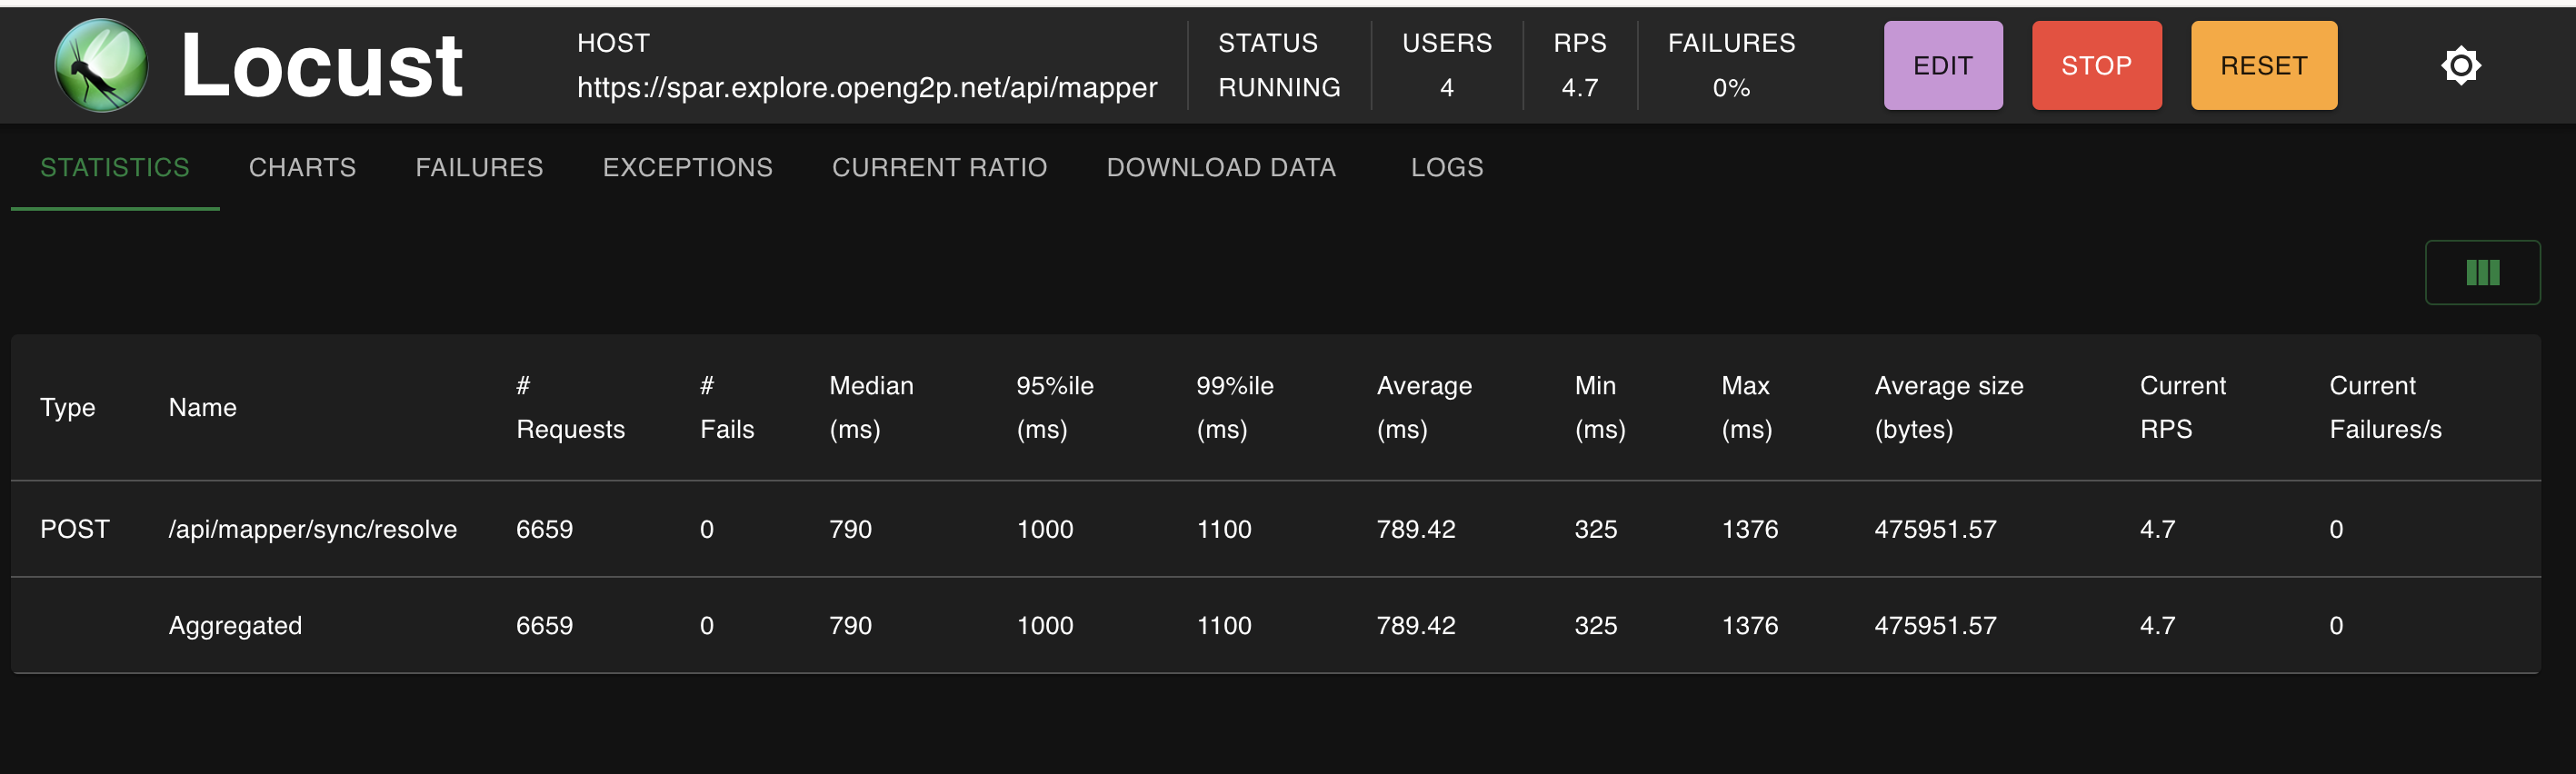
Locust Dashboard - 30 minutes - 8 concurrent users - 1000 records per API
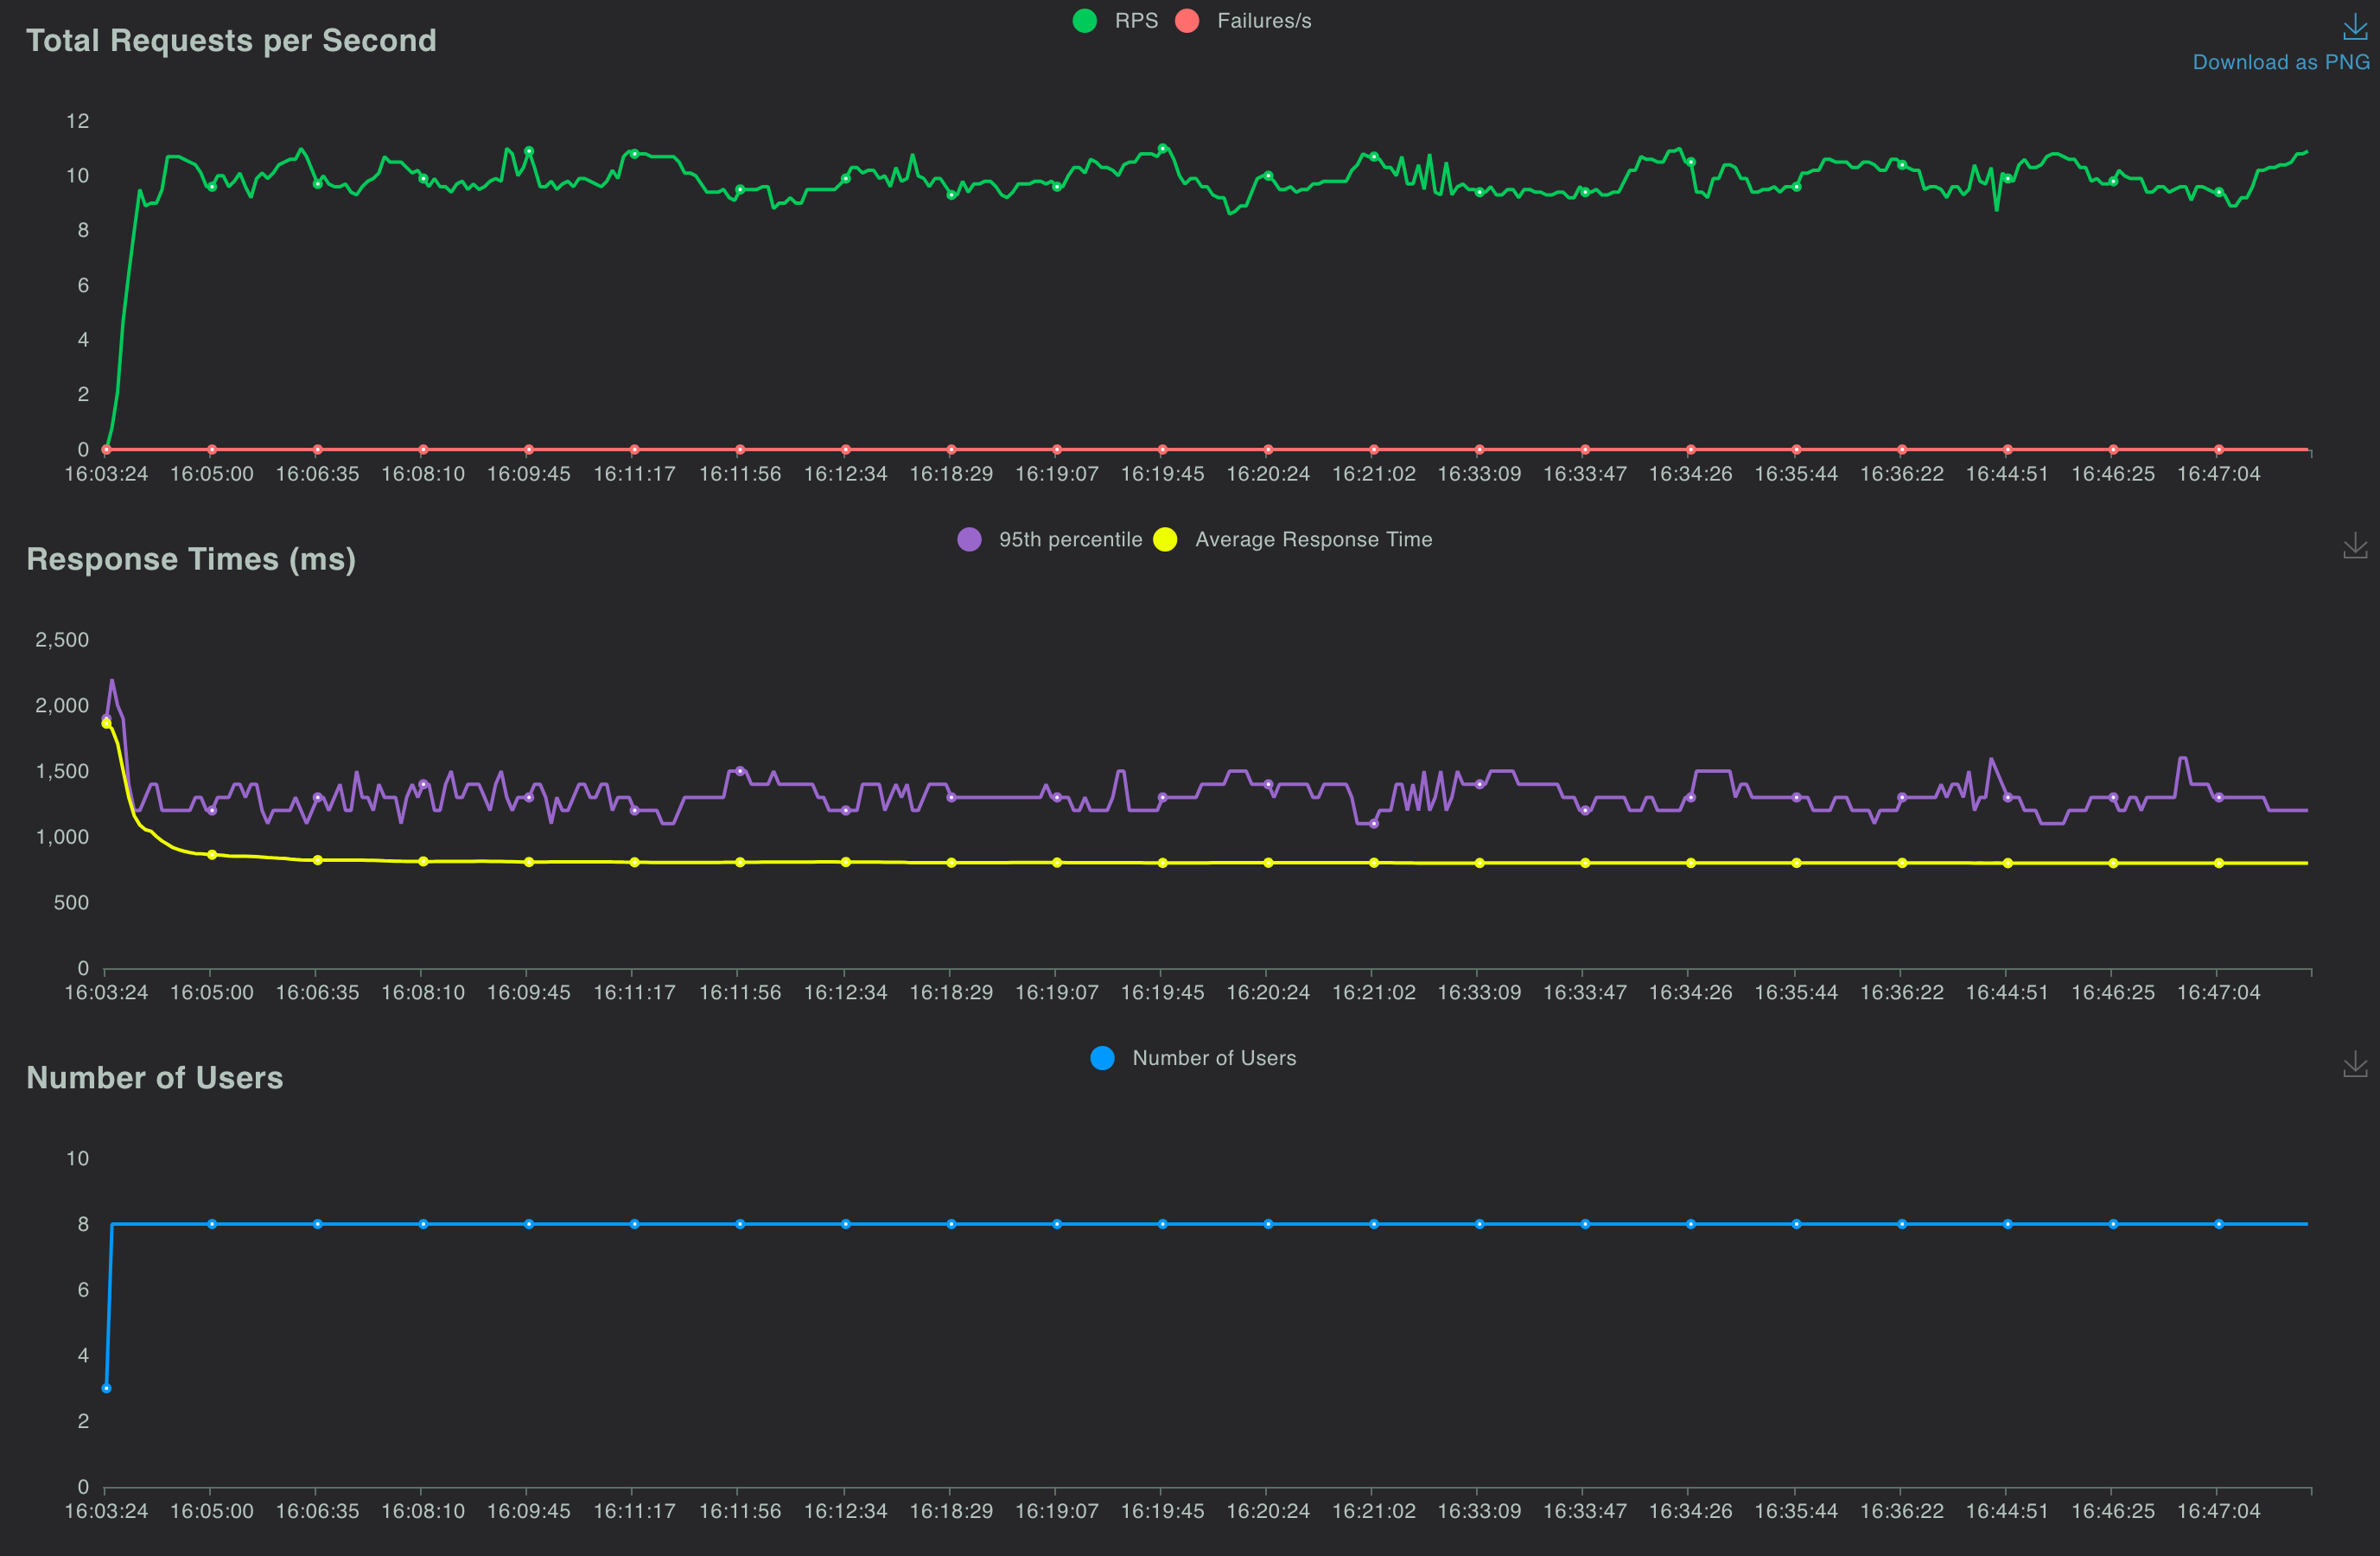
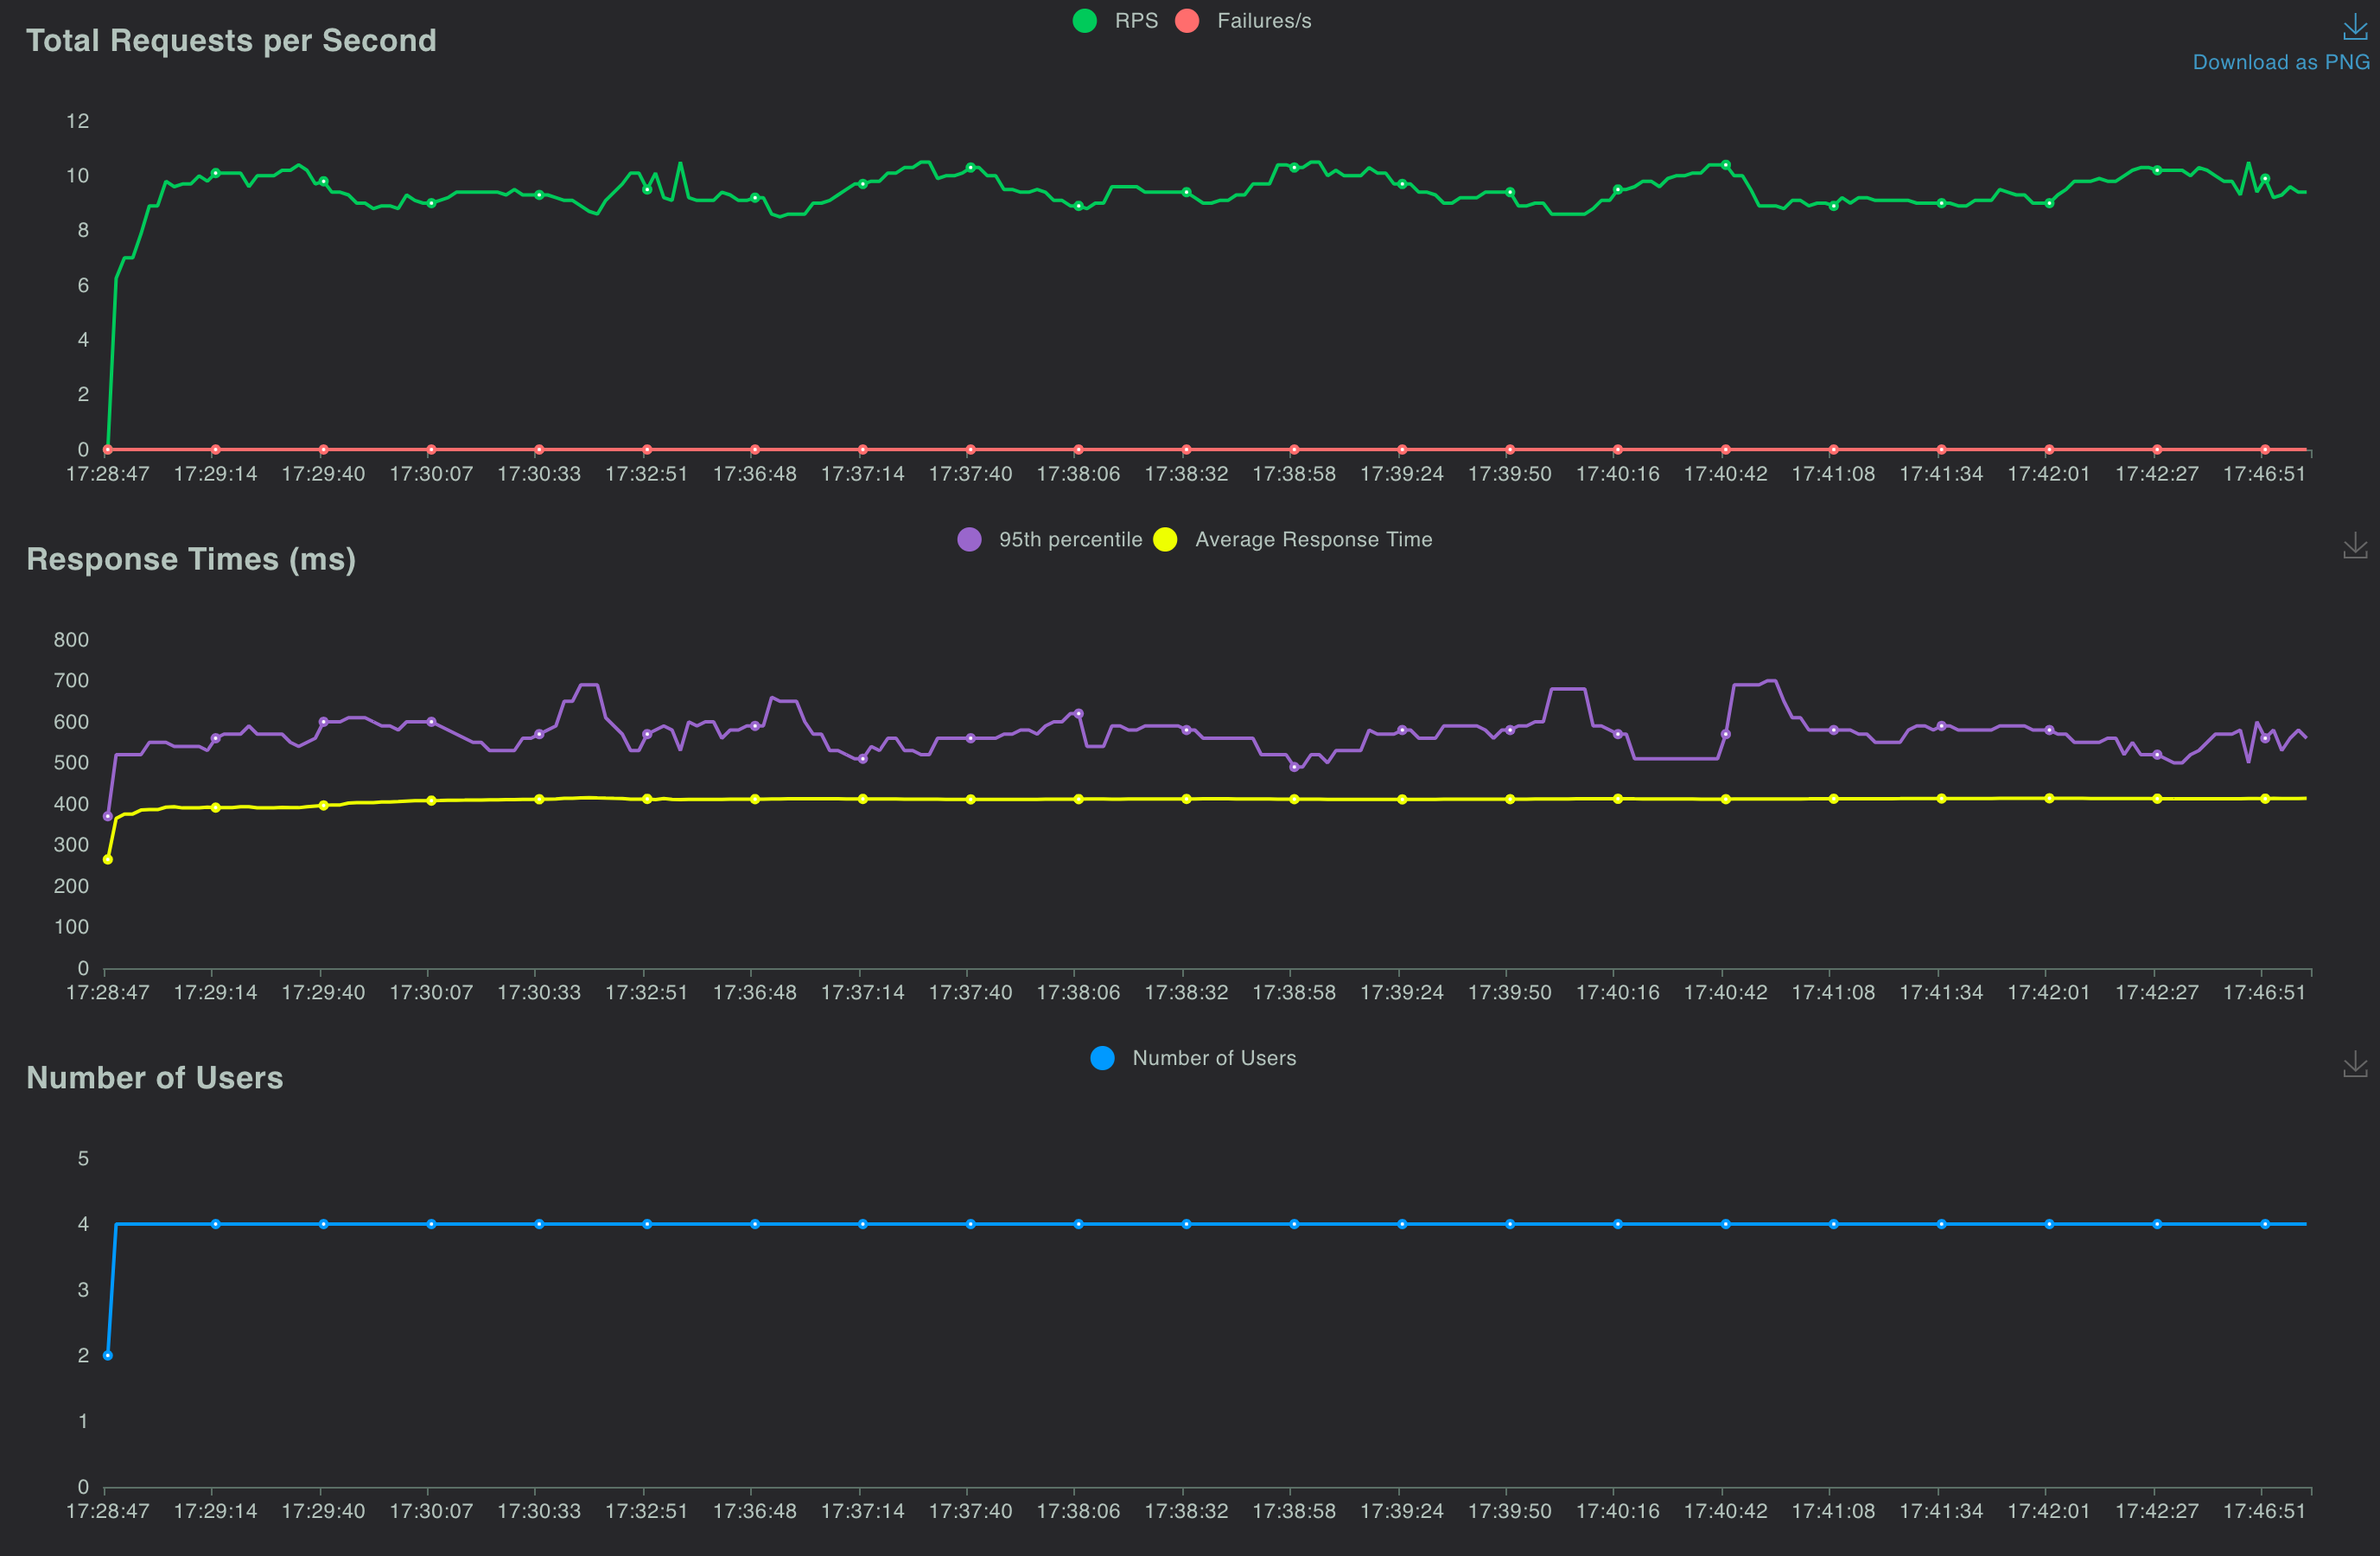
Locust Charts - 30 minutes - 8 concurrent users - 1000 records per API
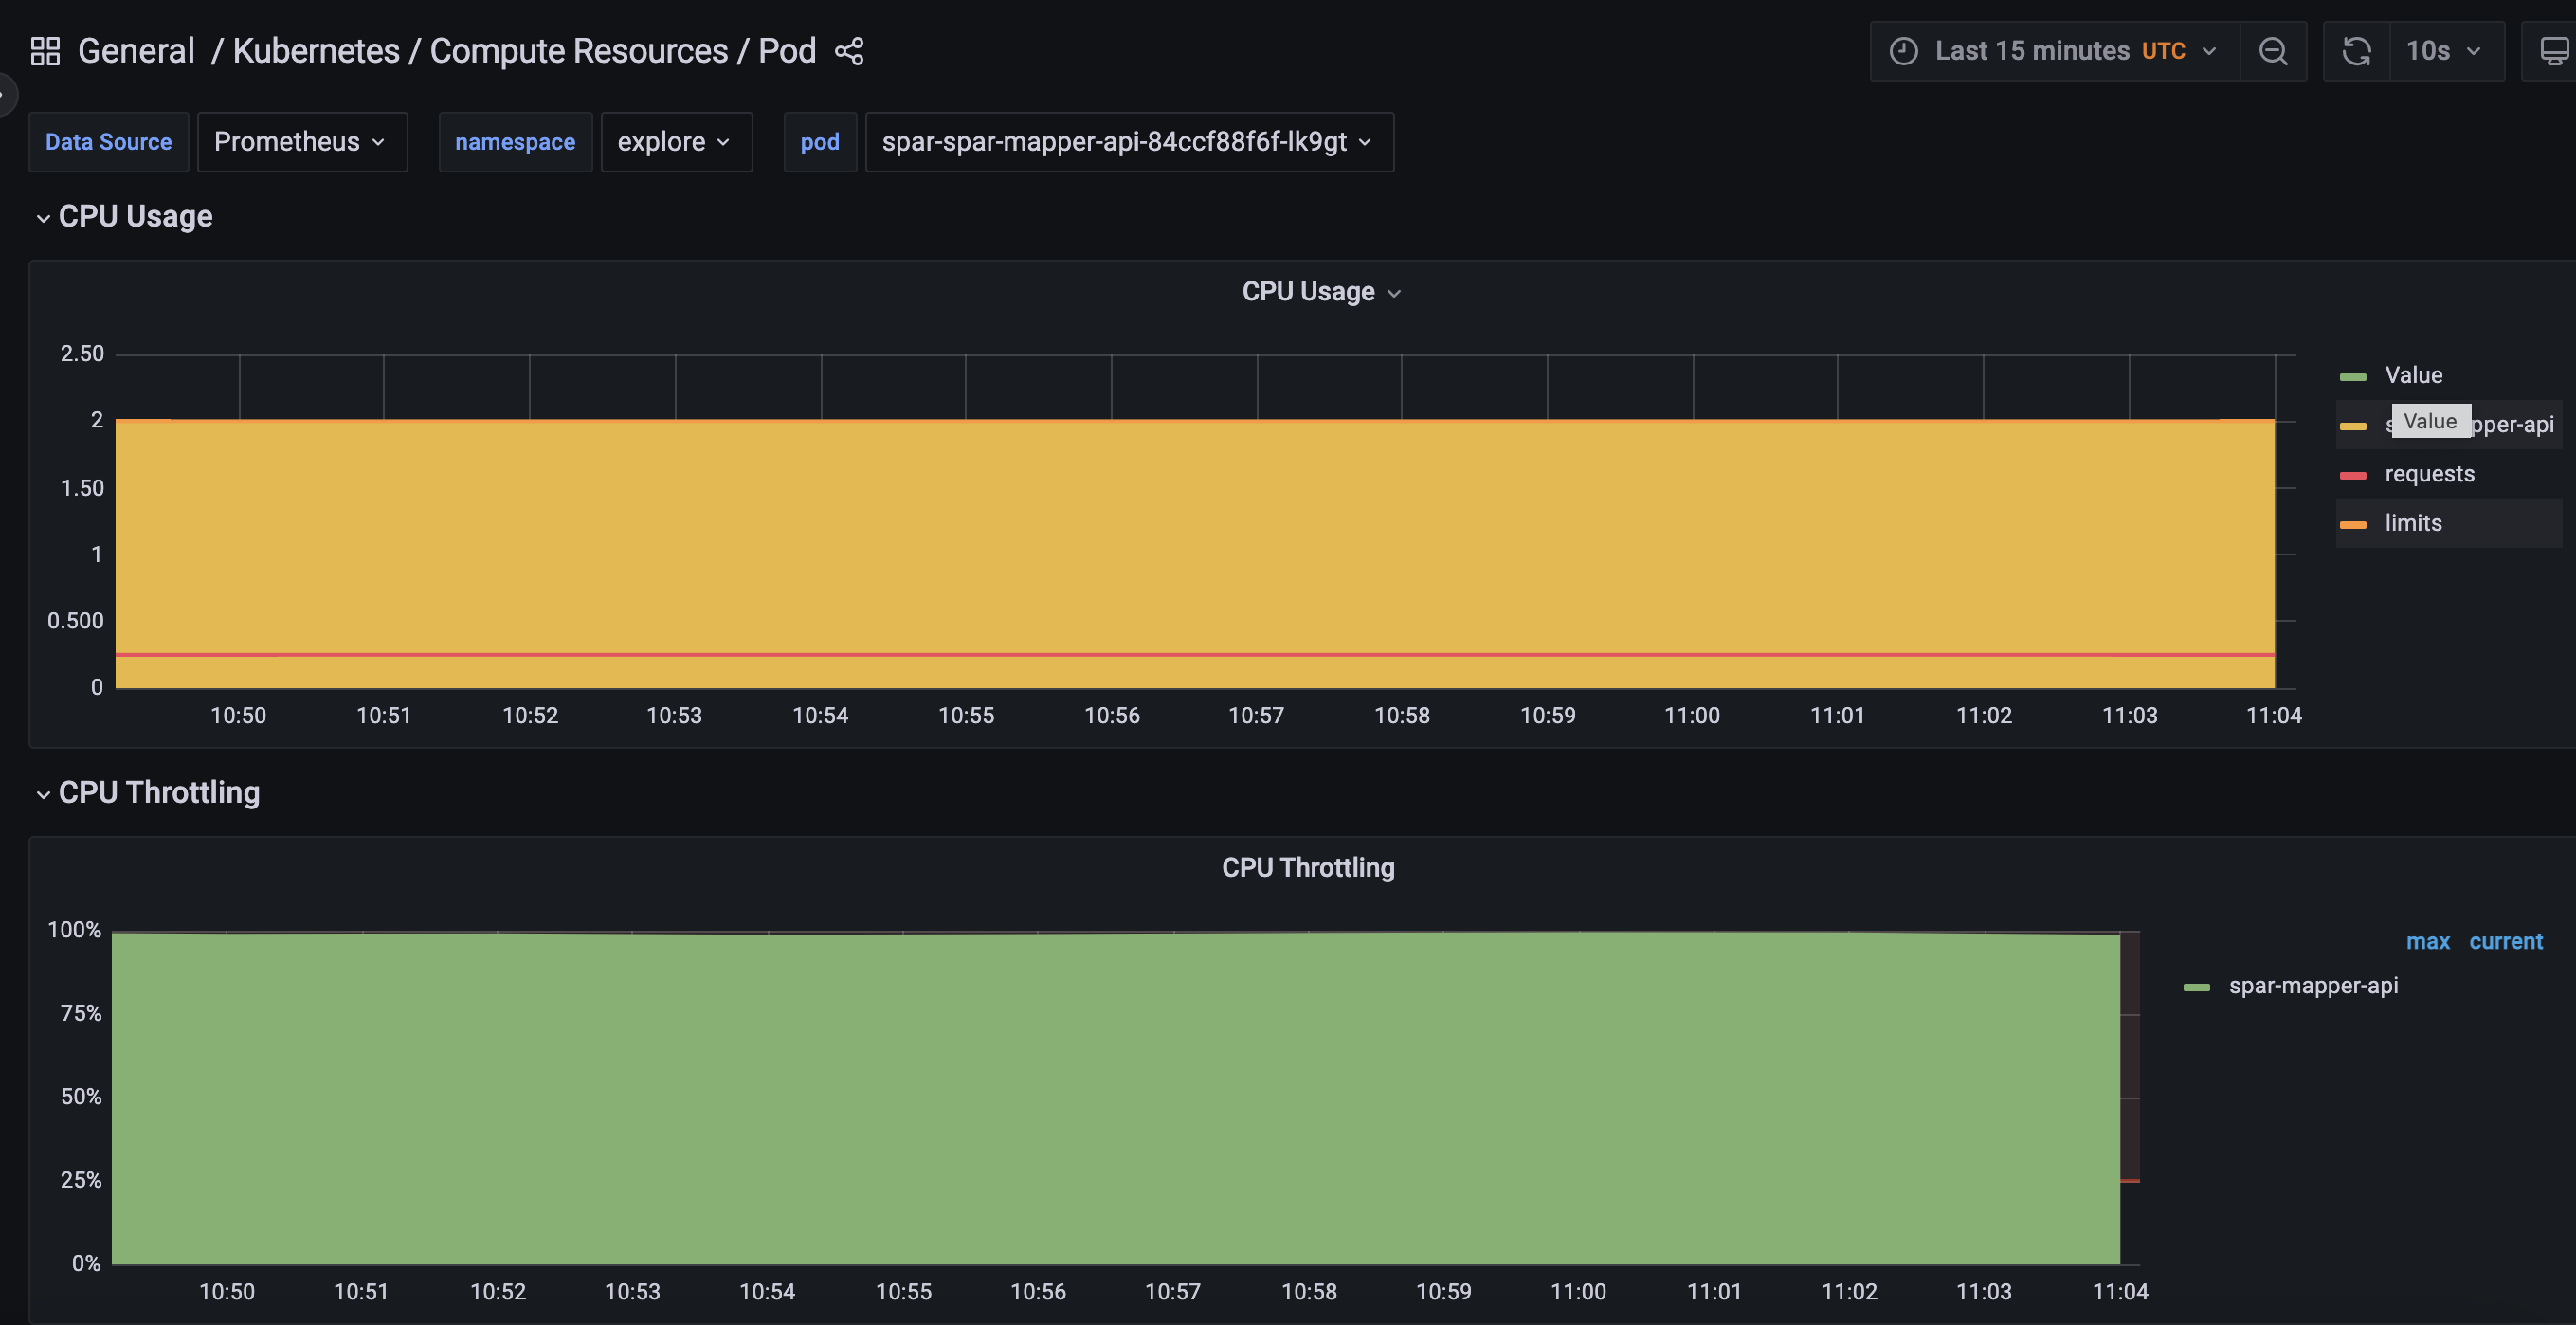
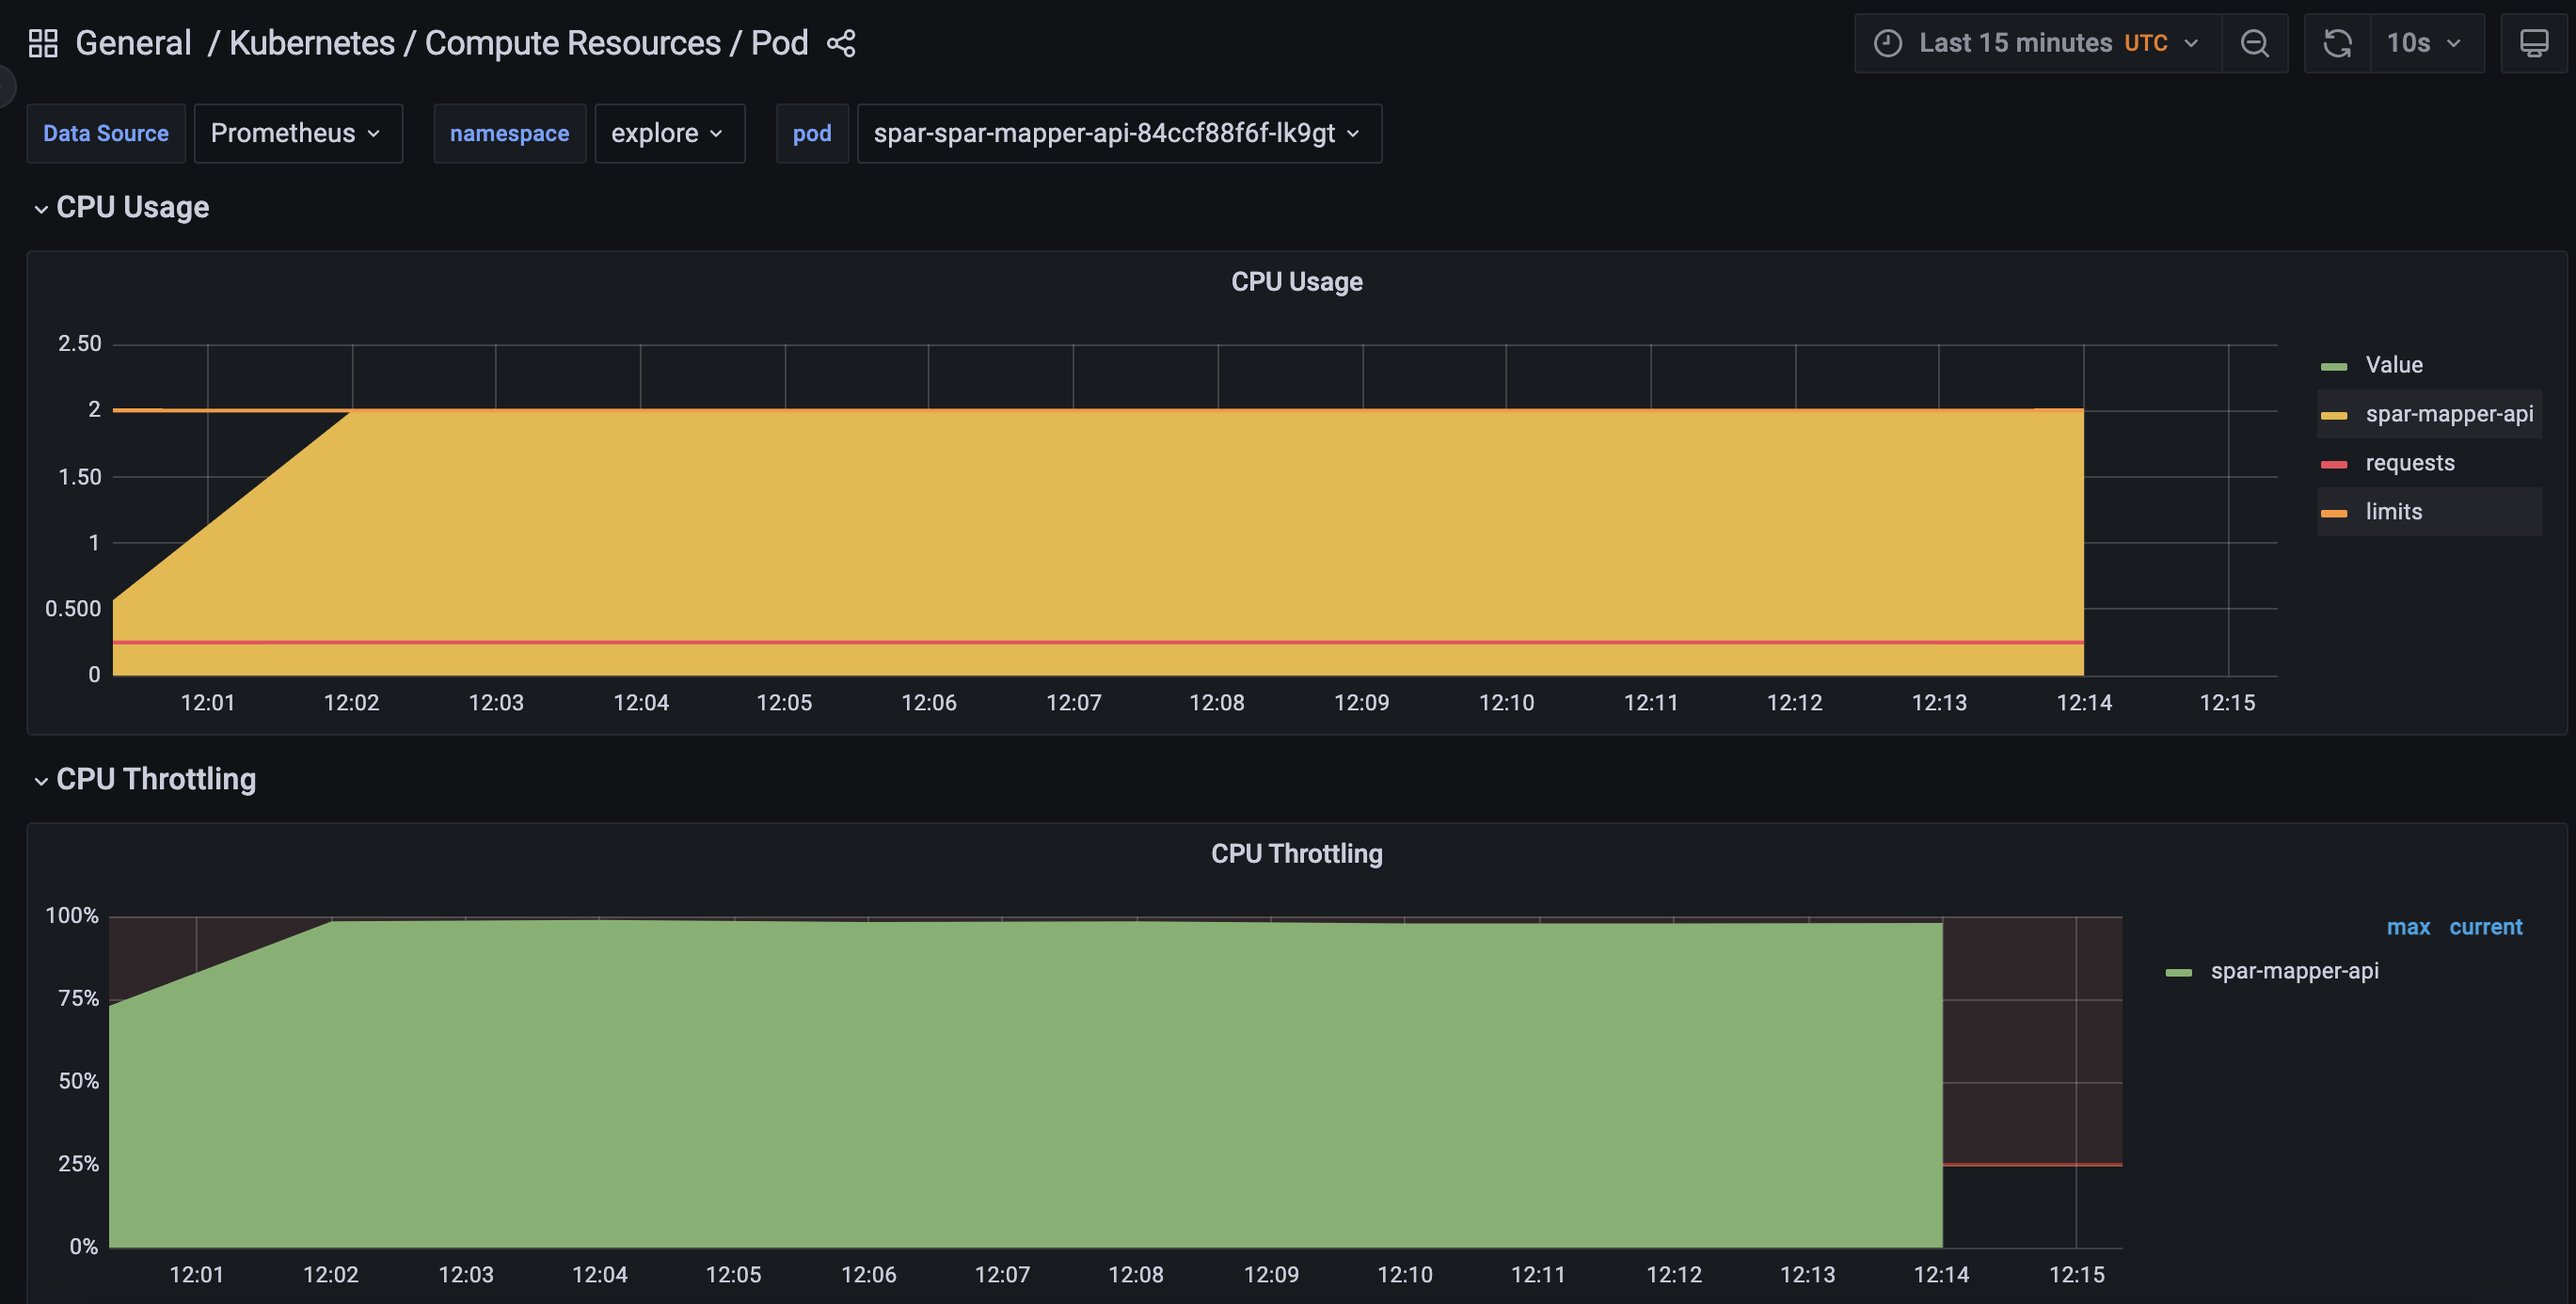
CPU throttle - 30 minutes - 8 concurrent users - 1000 records per API
| POD | CPU Utilization | Memory Utilization |
|---|---|---|
| Mapper POD | 2 cpu | 546 MB |
| Postgres POD | 0.225 cpu | 1.7 GB |
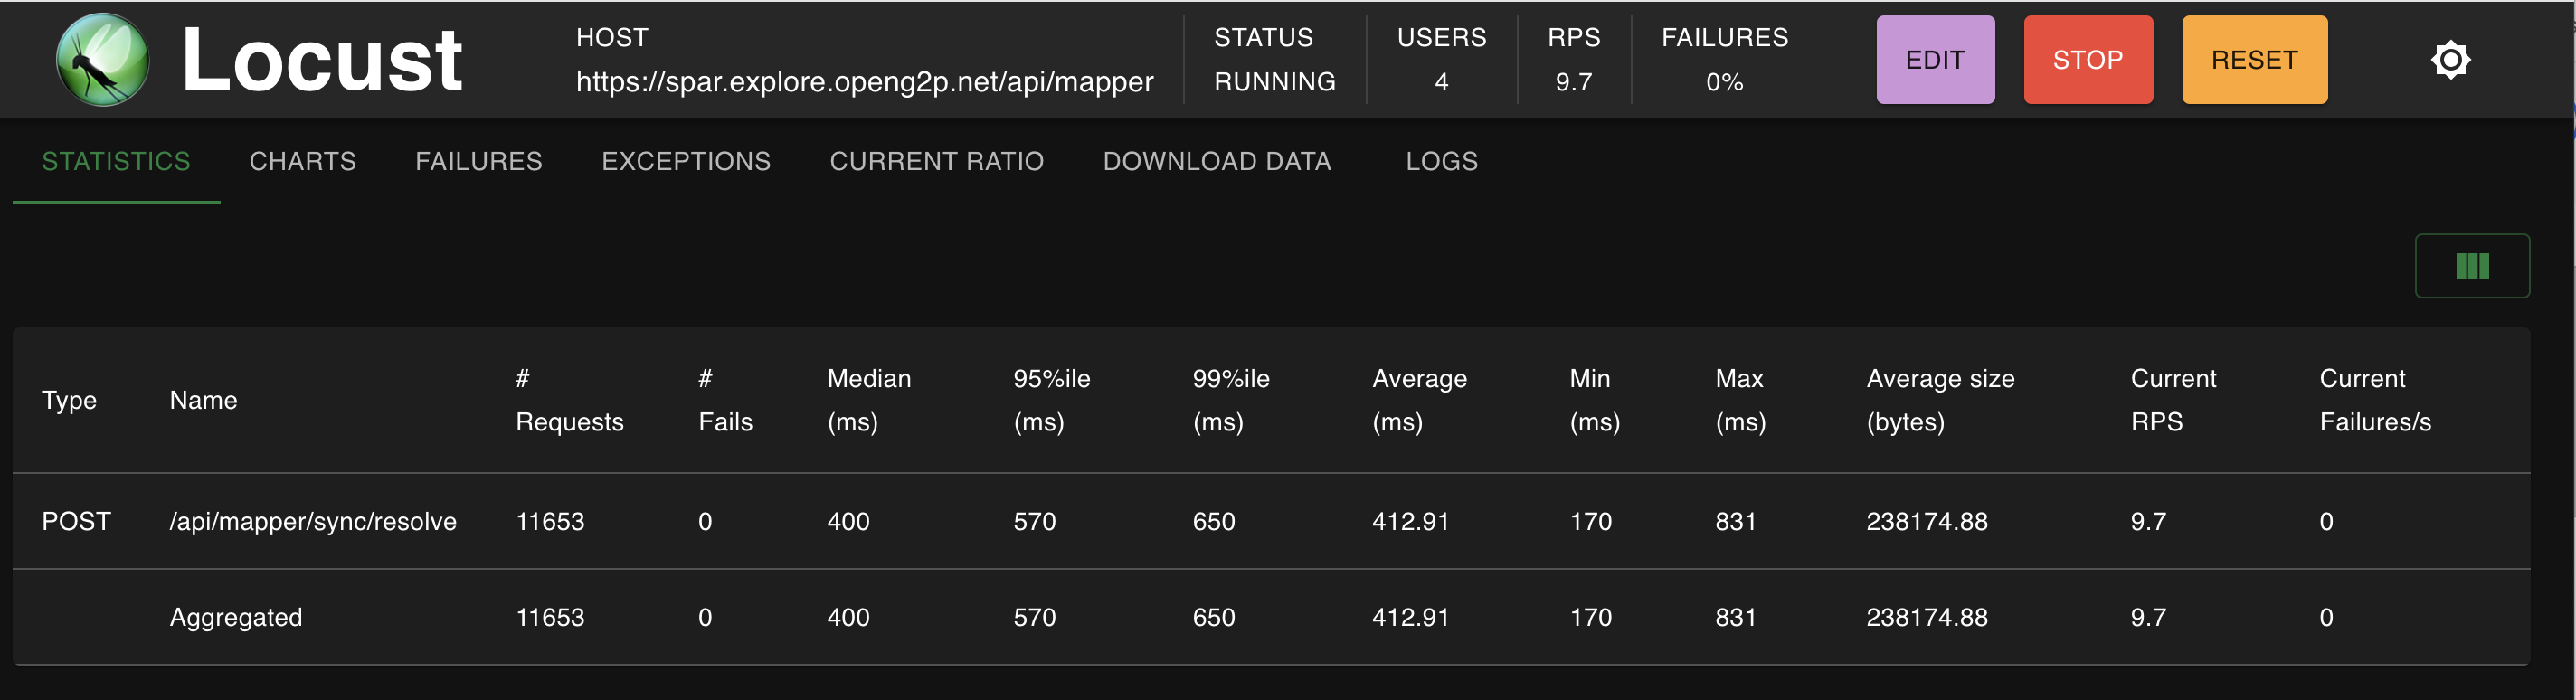
Locust Dashboard - 30 minutes - 4 concurrent users - 1000 records per API
Locust Charts - 30 minutes - 4 concurrent users - 1000 records per API
CPU throttle - 30 minutes - 4 concurrent users - 1000 records per API
| POD | CPU Utilization | Memory Utilization |
|---|---|---|
| Mapper POD | 2 cpu | 590 MB |
| Postgres POD | 0.235 cpu | 1.7 GB |
Locust Dashboard - 30 minutes - 4 concurrent users - 2000 records per API
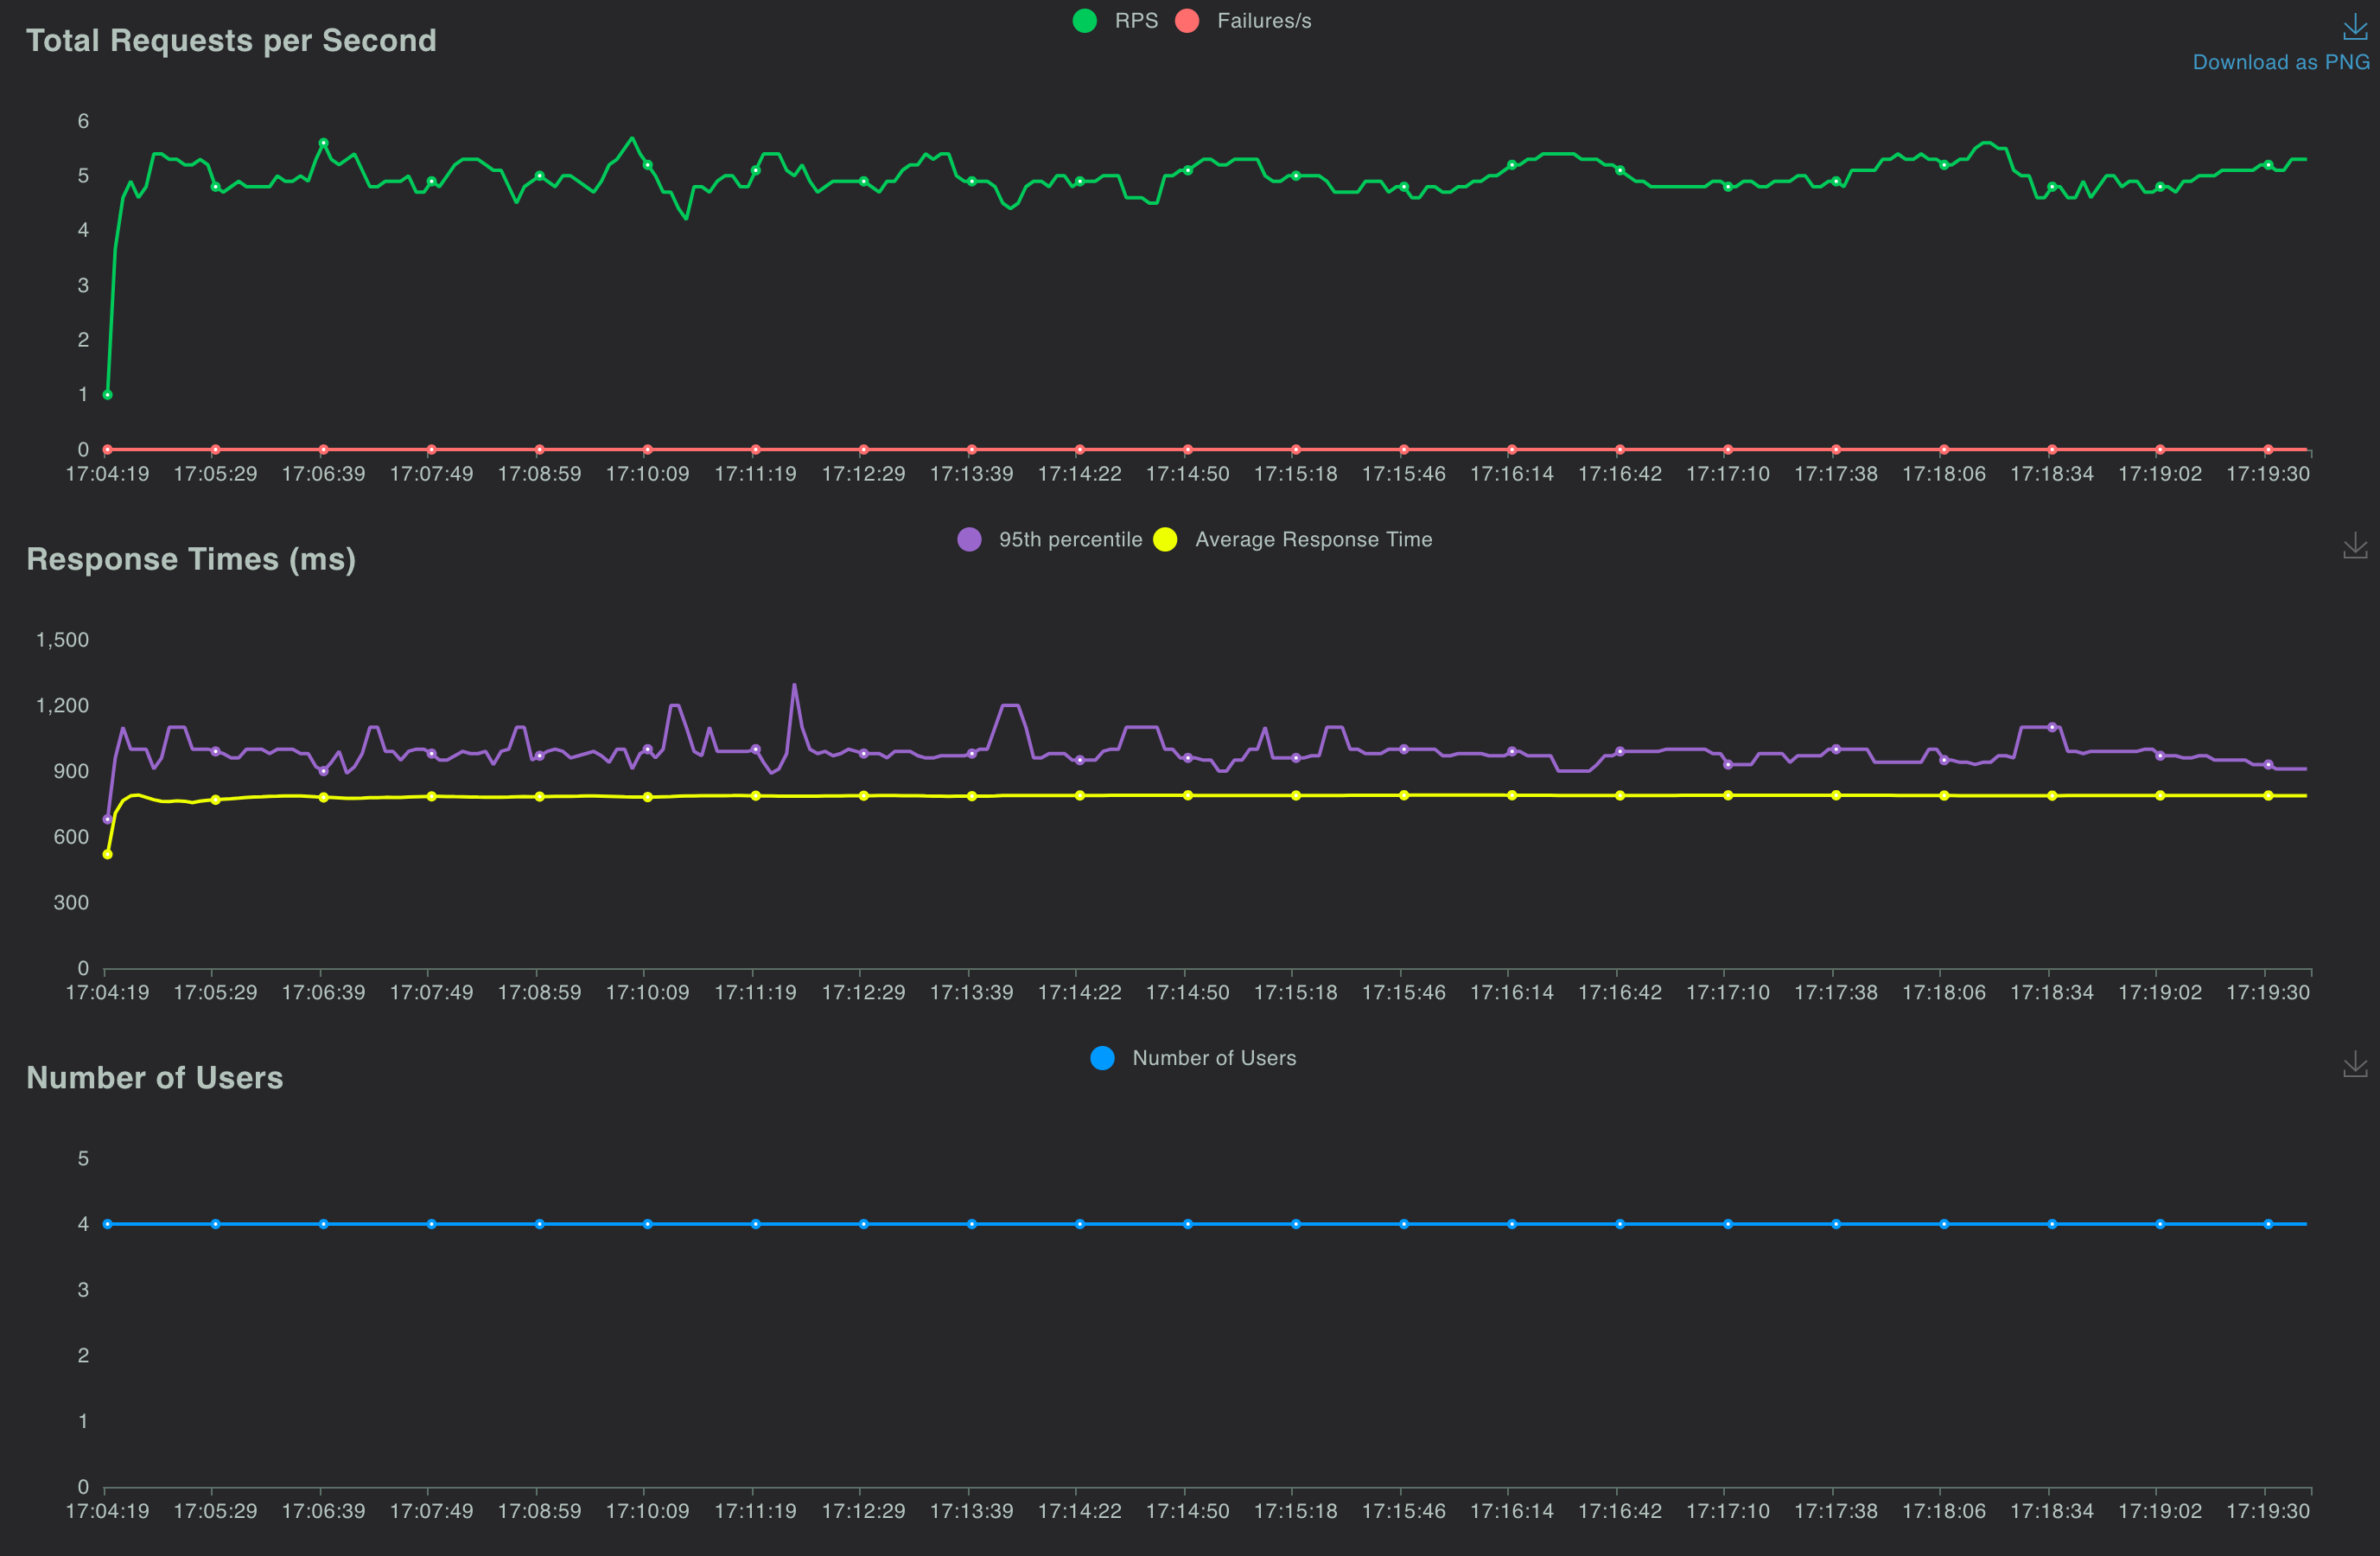
Locust Charts - 30 minutes - 4 concurrent users - 2000 records per API
CPU throttle - 30 minutes - 4 concurrent users - 2000 records per API