> For the complete documentation index, see [llms.txt](https://docs.openg2p.org/llms.txt). Markdown versions of documentation pages are available by appending `.md` to page URLs; this page is available as [Markdown](https://docs.openg2p.org/products/registry/disability-registry/dashboards.md).
# Dashboards and maps
The seven Superset dashboards shipped with the Disability Registry, the reporting views behind them, and the Insights map surface.
The registry ships a complete analytics layer: reporting views over the register, seven Superset dashboards built on those views, and a map surface for G2P Insights. All three are on by default.
## The reporting views
Charts read **views**, never the register tables — so a chart is a simple `SELECT` rather than a repeated multi-table join with JSONB digging.
Two are hand-written and semantic:
| View | Grain | Why it is hand-written |
| --------------------- | -------------------------- | ------------------------------------------------------------------------------------------------------------------------------------------------------------------------------ |
| `dr_rpt_person` | one row per registrant | Derives age bands, the certificate-expired and reassessment-overdue flags, and the `unmet_need_and_unenrolled` coverage gap |
| `dr_rpt_support_need` | one row per support record | A **union** across all five support sub-registers, with one shared definition of `is_unmet`. The generator's model is one view per entity, so it could not produce this at all |
Thirteen more are generated mechanically from the schema — one per entity, with geography inherited from the parent and personal data withheld.
{% hint style="info" %}
**Geography is positional.** Views unpack `geo_code_hierarchy_json` into `geo_1..geo_5` by ordinality, never by level name, so the same chart works for a country with regions/districts/wards and one with provinces/communes. Nothing in a chart names an administrative level.
{% endhint %}
These are **materialized** views. Postgres does not update them when the register changes, so a CronJob rebuilds them hourly (`analytics.reportingViews.refreshSchedule`). Between refreshes, newly registered people do not appear in any report — and nothing reports an error. Empty the schedule to disable the refresh and leave the views static.
## The dashboards
Seven dashboards, 59 charts, ordered as a caseworker's questions are.
Every chart reads a reporting view, so geography and age bands mean the same thing on all of them
| Dashboard | Charts | Answers |
| ---------------------------------- | ------ | ----------------------------------------------------------------------------------------------------------------------------------------------- |
| **Unmet Support Need** | 8 | How many people need support they are not getting, of what kind, and where? Includes "unmet need, no programme" — a work list, not an indicator |
| **Support Provision** | 7 | What is actually being delivered, and what is the fulfilment rate by domain and by area? |
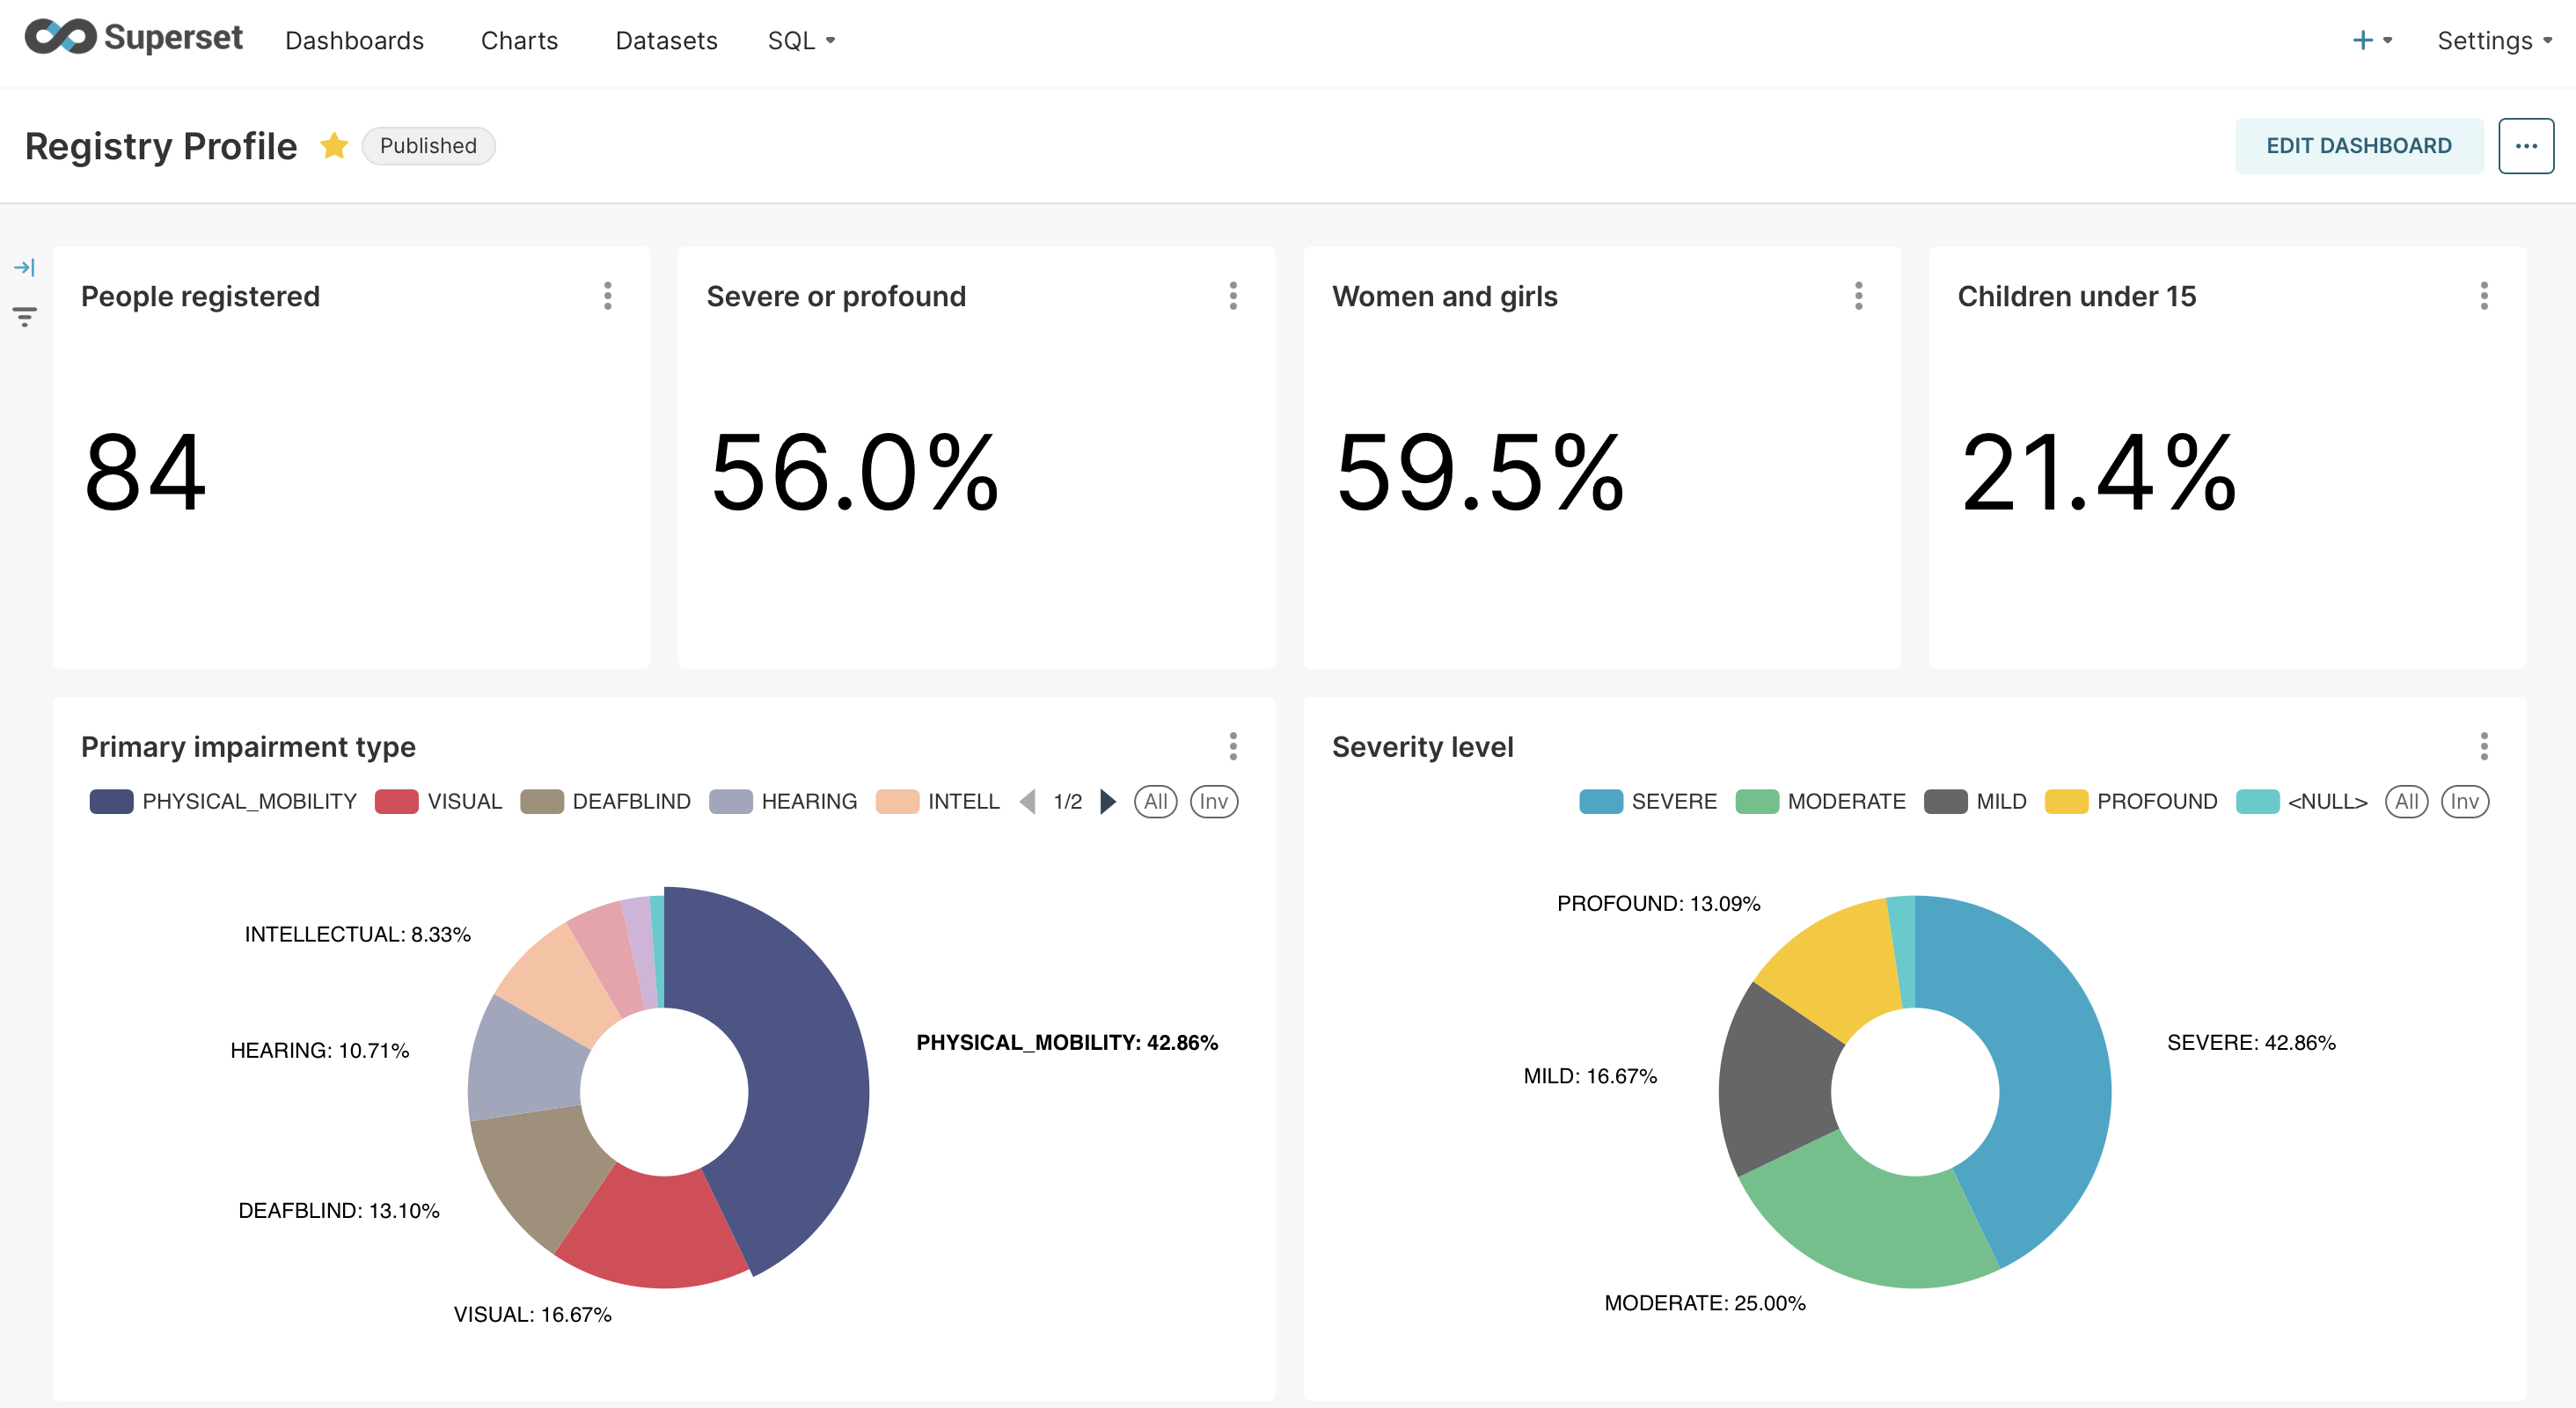
| **Registry Profile** | 11 | Who is registered — impairment type, severity, cause, age of onset, sex, age band |
| **Programme Coverage** | 7 | Who is enrolled, and does coverage rise with severity? A flat line means the programme is not reaching the people it was designed for |
| **Inclusion & Independent Living** | 11 | Work, housing, legal capacity, education — the UNCRPD outcomes rather than service counts |
| **Care Network** | 7 | Who has a caregiver, who lives alone, and who has extensive needs and no caregiver at all |
| **Register Health** | 8 | Expired certificates, overdue re-assessments, records awaiting assessment, missing impairment detail |
Every dashboard carries native filters for **sex** and **area**, so one control re-cuts every chart rather than doubling the chart count.
{% hint style="info" %}
Only viz types present in both Superset 4.0.1 and 6.x are used — `big_number_total`, `pie`, `echarts_timeseries_bar`, `table`. `dist_bar` is avoided deliberately: it exists in 4.0.1 but was removed with the NVD3 plugin, so a chart using it saves fine and then renders blank.
{% endhint %}
### The bundle
Dashboards are imported from `files/dr-dashboards.zip`, shipped in the chart and mounted as a ConfigMap. Asset UUIDs are derived with `uuid5` from stable keys, so **re-importing updates the existing dashboards in place** rather than duplicating them — which is what makes the import safe to run on every install and upgrade.
Rebuild it — never hand-edit — whenever the reporting views change:
```bash
python docker/dashboards/build_bundle.py \
--out helm/openg2p-disability-registry/files/dr-dashboards.zip
```
The builder reads the views' **real column list**, so they must exist in a reachable database when you run it.
### Requirements
The import needs a Superset reachable at `analytics.dashboards.superset.url` (default `http://commons-services-superset:8088`). An **absent** Superset skips the import rather than failing the install — a registry must come up whether or not a reporting stack was deployed beside it. Set `analytics.dashboards.superset.required=true` where the dashboards are load-bearing.
## Maps
The registry contributes four queries and a page to the G2P Insights map surface, published as a ConfigMap for Insights to mount. Harmless when Insights is not installed — nothing else reads it.
| Source | Grain |
| ---------------------------- | ----------------------------------------------------------------------- |
| `level1_summary.sql` | First level below country |
| `level2_summary.sql` | One level deeper |
| `level3_summary.sql` | Third level — usually the lowest with a published boundary |
| `level2_unmet_by_domain.sql` | Unmet need **by support domain**, with the most-requested item per area |
Three deliberate choices:
* **Colour is always unmet need, never population.** A density map just reproduces where people live and tells an administrator nothing they can act on.
* **The by-domain query exists because "unmet need" alone does not say who acts.** Assistive technology is a procurement problem, housing support a public-works problem, human assistance a caregiver-allowance problem — three budgets, three ministries. `top_unmet_type` names the single most-requested item per area, which is a procurement line.
* **No rates at level 3.** A unit at that depth often holds a handful of registrants, and a percentage over six people is one person's record, rounded. Counts are exact at any size and need no suppression.
Drill-down is by **clicking** an area: level 1 filters level 2, which filters level 3.
## If the dashboards are empty
| Symptom | Likely cause |
| --------------------------------------- | ---------------------------------------------------------------------------------------------------------------------------- |
| Dashboards exist, all charts empty | No records — `dbSeed.loadSampleData` was off, or the register is genuinely empty |
| Charts show data but every map is blank | Geography did not resolve: the records carry place **names** but no Master Data ids. Load a country pack and re-run the seed |
| Data is stale | The refresh CronJob has not run yet, or its schedule is empty |
| No dashboards at all | `analytics.dashboards.enabled=false`, or Superset was unreachable and the import skipped — check the `dr-dashboards` Job log |
---
# Agent Instructions
This documentation is published with GitBook. GitBook is the documentation platform designed so that both humans and AI agents can read, navigate, and reason over technical content effectively. Learn more at gitbook.com.
## Querying This Documentation
If you need additional information that is not directly available in this page, you can query the documentation dynamically by asking a question.
Perform an HTTP GET request on the current page URL with the `ask` query parameter, and the optional `goal` query parameter:
```
GET https://docs.openg2p.org/products/registry/disability-registry/dashboards.md?ask=&goal=
```
`ask` is the immediate question: it should be specific, self-contained, and written in natural language.
`goal` is optional and describes the broader end goal you are ultimately trying to accomplish on behalf of the user. GitBook uses it to tailor the answer towards what is most useful for that goal.
The response will contain a direct answer to the question and relevant excerpts and sources from the documentation.
Use this mechanism when the answer is not explicitly present in the current page, you need clarification or additional context, or you want to retrieve related documentation sections.